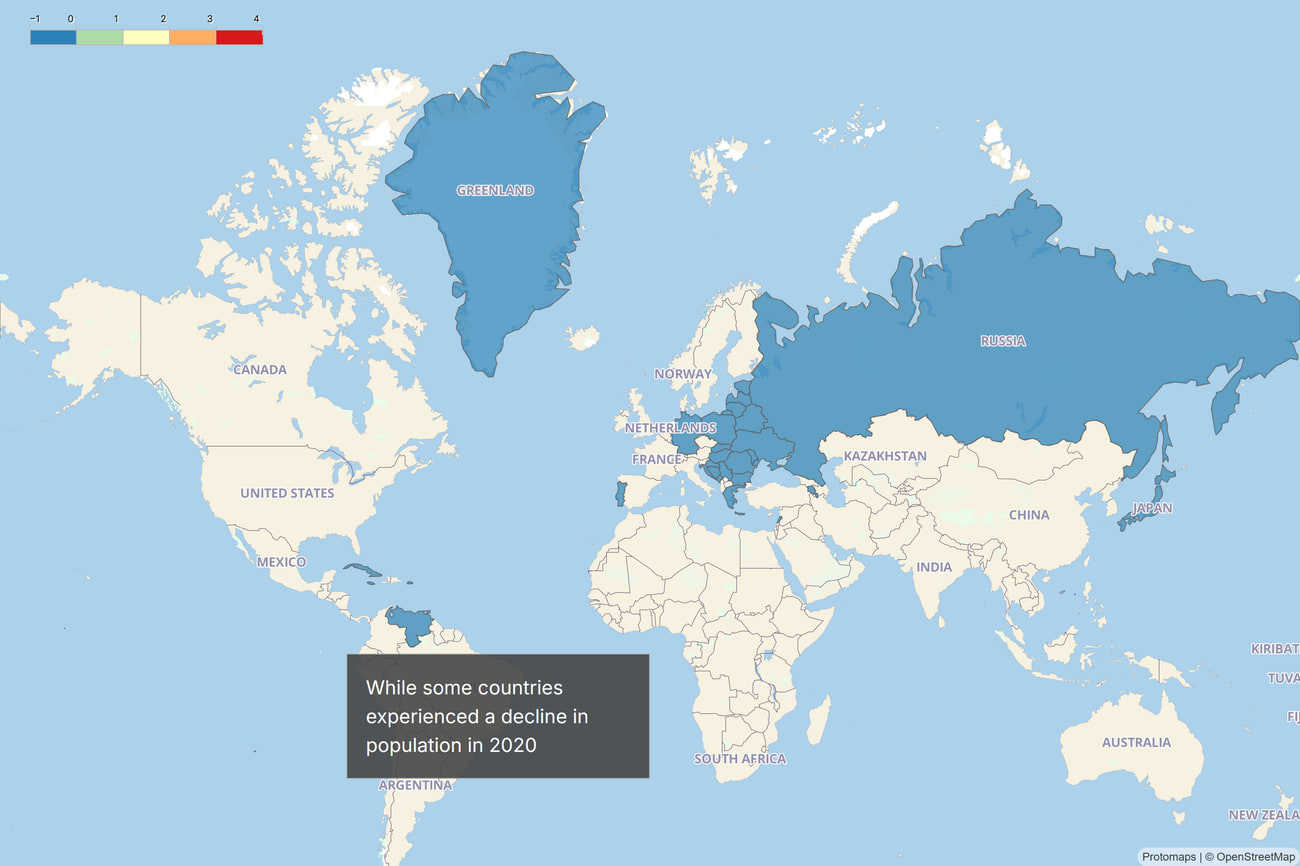
Tell the full story
Guide readers through a sequence of findings while one connected visualization carries the narrative.

Data storytelling, made clear
Build interactive stories from spreadsheets, with connected charts, maps, narrative, and reader controls. No code required.
Used by teams at






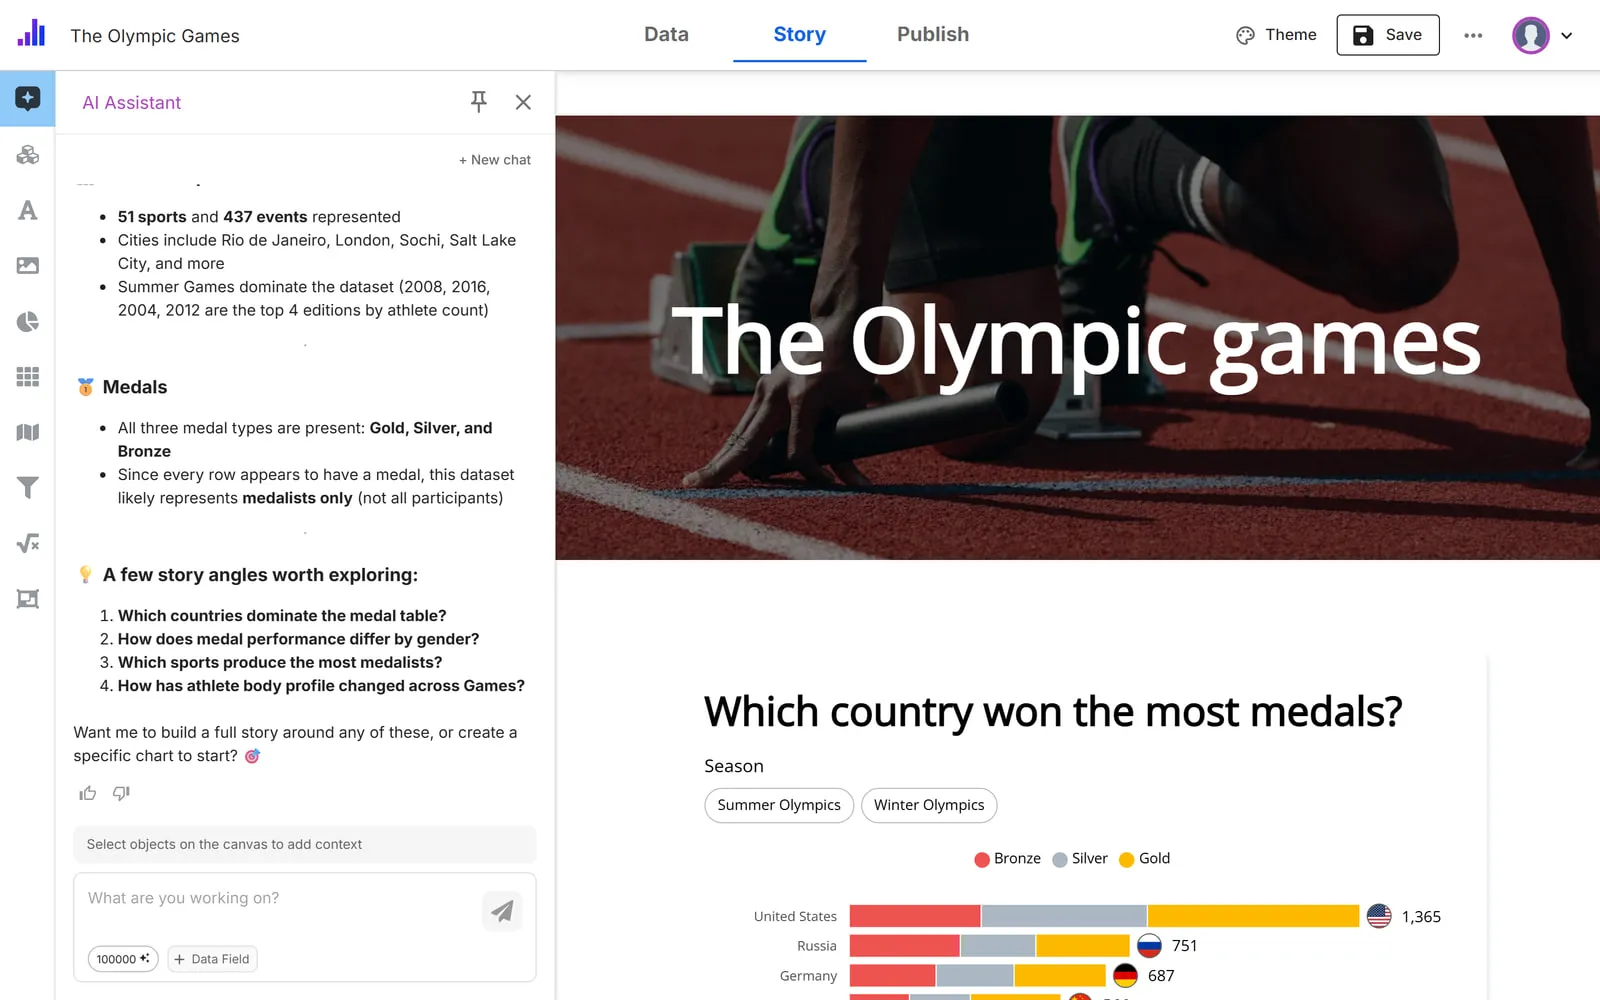
Paste a table, upload Excel, connect a Google Sheet, or start with trusted data from our catalog.
Connect charts, maps, text, annotations, and filters into one complete experience.
Share a link, embed the story, or use your own domain.
Move from raw data to a clear, interactive narrative without piecing together different tools.
Guide readers through a sequence of findings while one connected visualization carries the narrative.
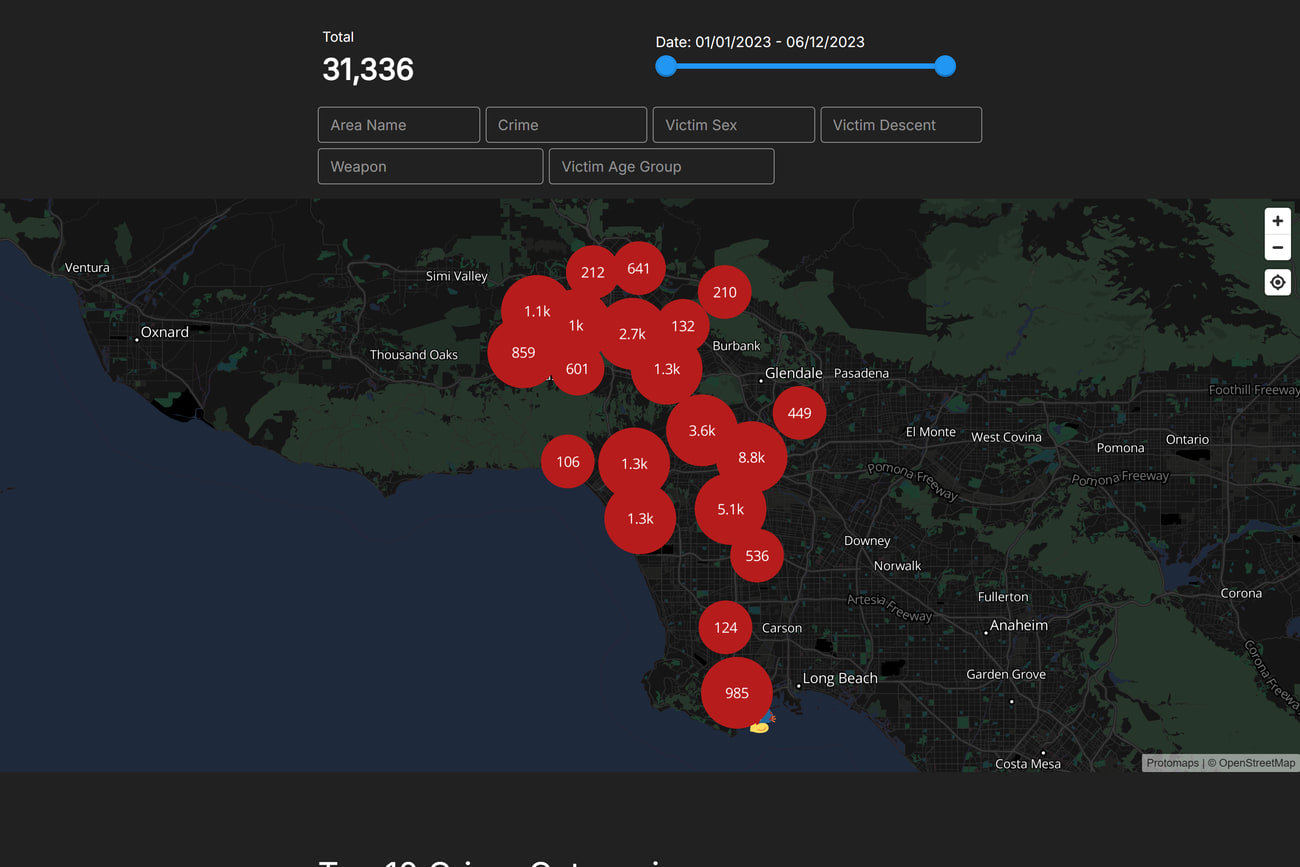
Filter a real-world map and open details without losing the thread.
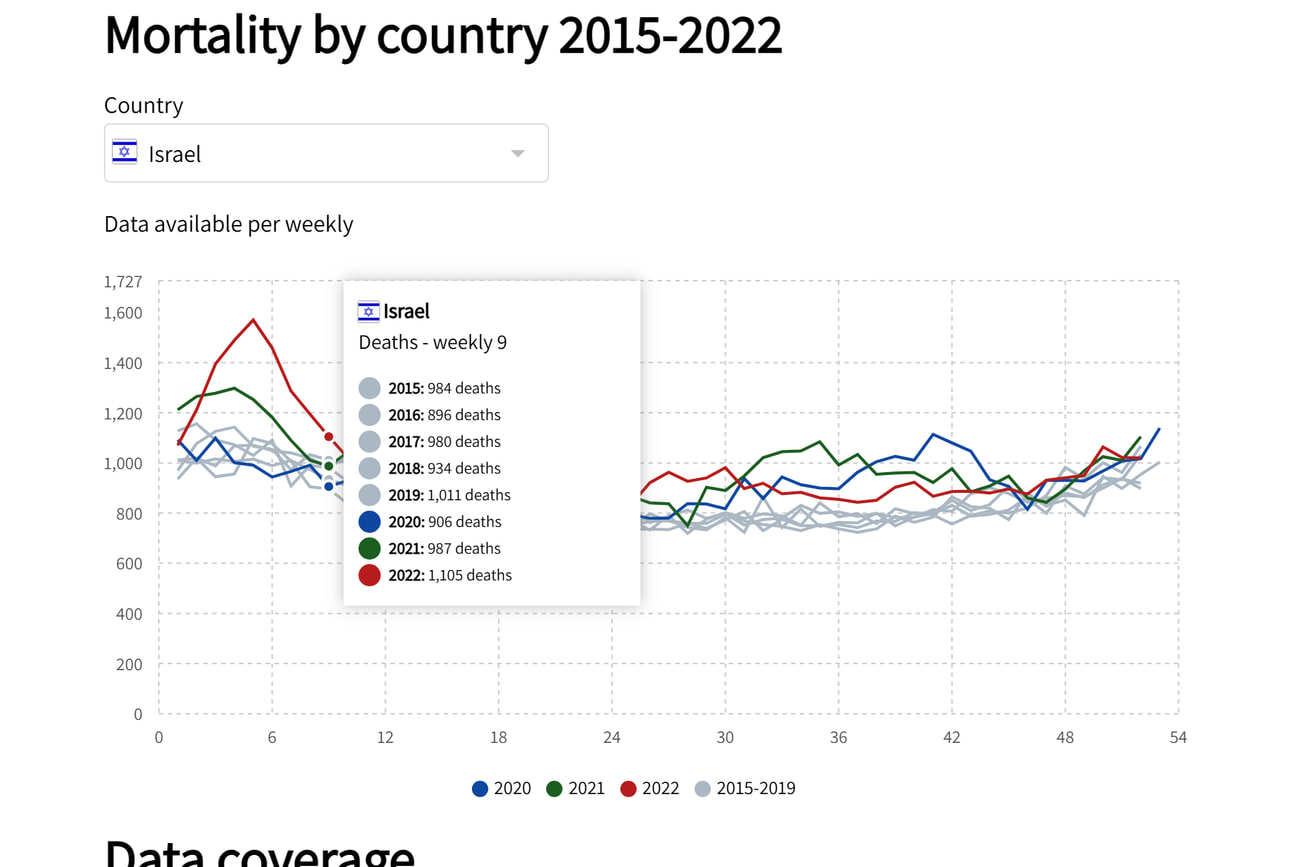
Add an annotation exactly where readers need context.
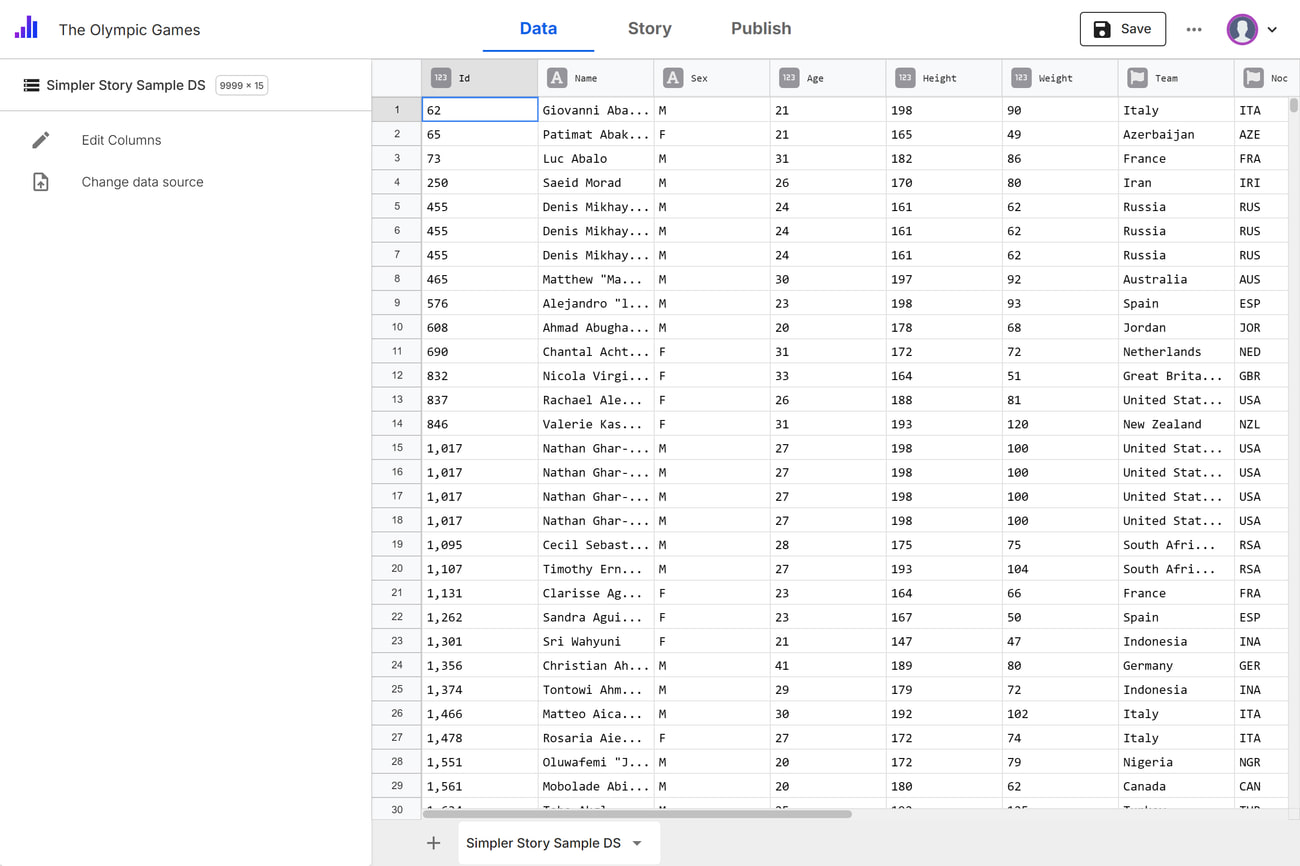
Turn a spreadsheet into a chart, then refresh it as new data arrives.
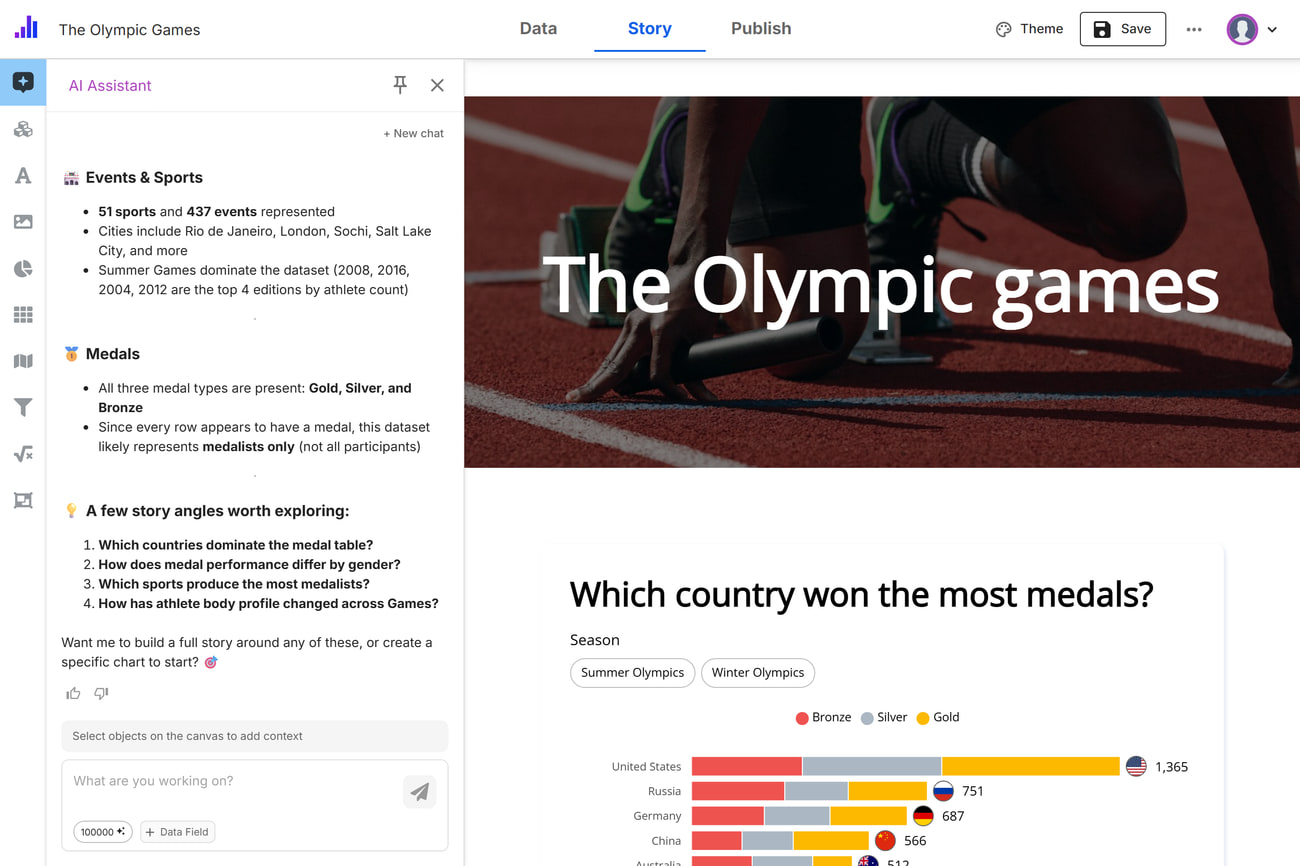
Get a quick read on any dataset, plus story angles worth exploring, without changing the source.
AI app connector
Connect Claude, or another AI app that supports MCP, to your Simpler Story account. Ask for a story in plain words: it brings in the data, builds the charts, maps, and text, checks its own draft, and sends you a link to open it in the editor.
Connection address
https://app.simplerstory.com/api/mcpOther AI apps that support custom connectors (MCP) connect the same way.
“The platform helped us take processes that used to take months and turn them into a matter of weeks. It felt like a real collaboration.”
 Alejandro SafdieHead of Ecosystem, Research & MarketingTel Aviv Global & Tourism, Mayor’s Office, Tel Aviv-Yafo
“Simpler Story allows us to make sense of our data and create coherent, interactive stories that form an insightful narrative.”
 Elli GershenkroinExecutive Director, Union of Journalists
“An essential resource for research and education organizations to turn complex data into understandable, interactive visualizations.”
 Dr. Asaf WienerExecutive Director, ISOC-IL
“Simpler Story helps us explain investigative journalism and complex information quickly, with a beautiful visual display and no technical experience.”
 Noami NiddamChief Editor, Shakuf Media Organization
Ready to make it clear?
Start with a spreadsheet. Publish an interactive story in minutes.