Explain policy and performance
Connect headline figures to the definitions, context, and trends behind them.

For public-sector teams
Turn reports and spreadsheets into clear interactive stories that help people see what changed, why it matters, and how it affects them.
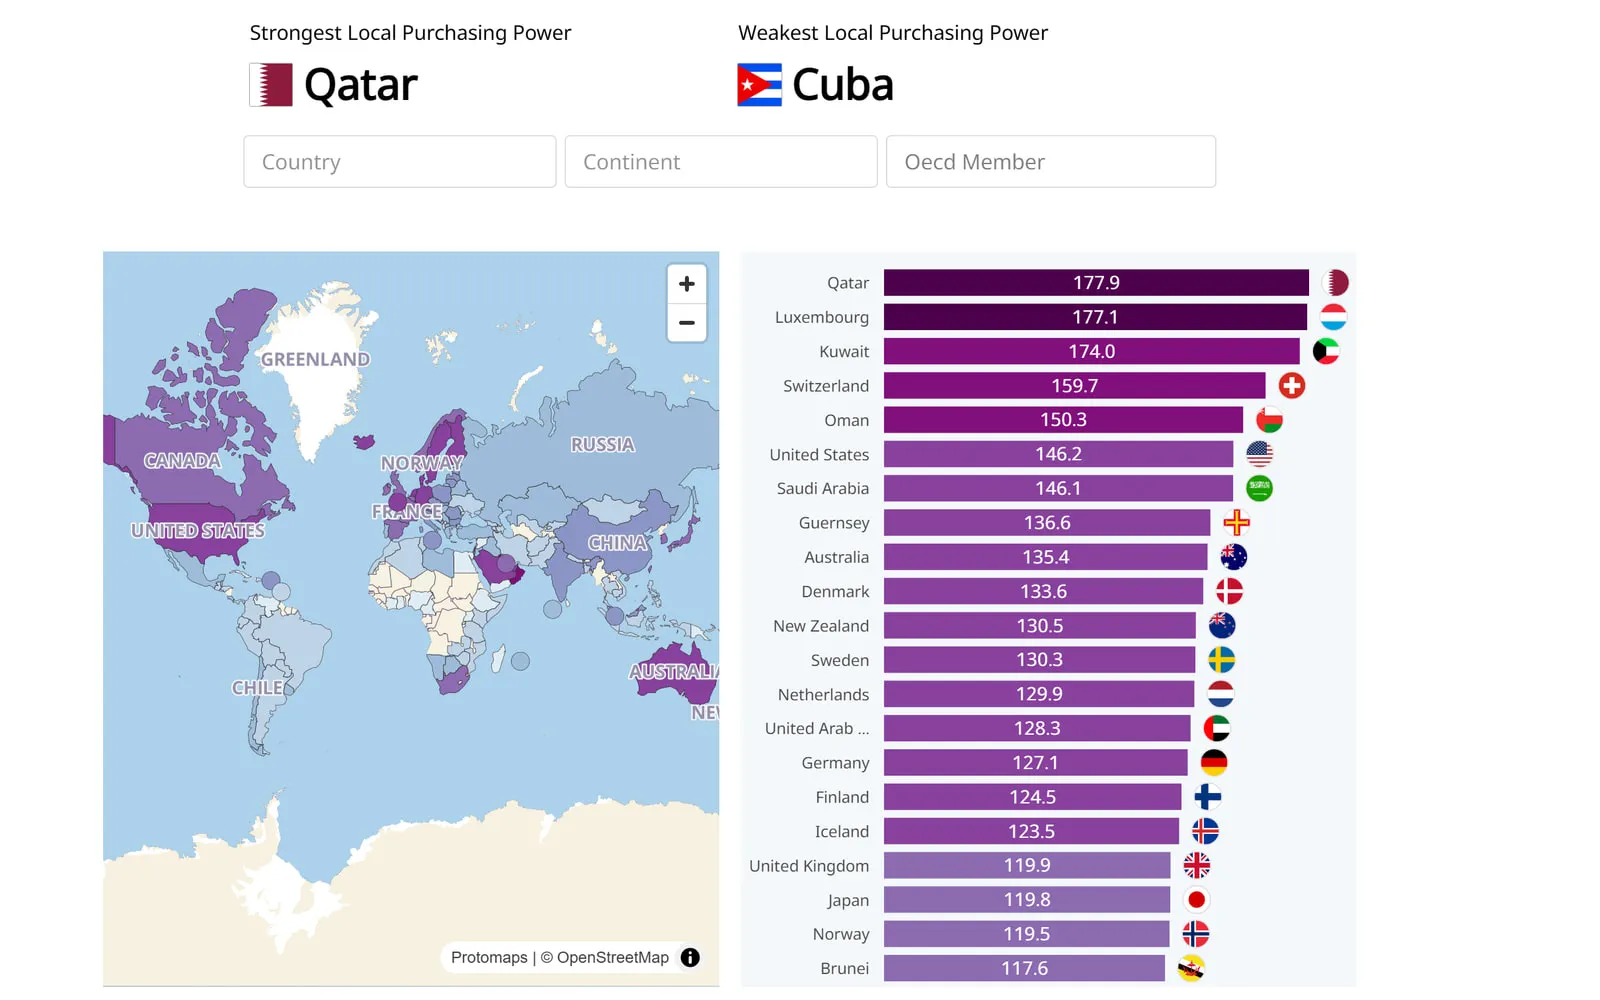
Maps, filters, labels, and explanatory text can work together in one published experience, without requiring a custom development project.
Open the exampleConnect headline figures to the definitions, context, and trends behind them.
Help people search by municipality, category, year, or another relevant dimension.
Create responsive stories that work across desktop, tablet, and mobile.
Connect stories to maintained data sources and update published work without rebuilding it.
Bring in spreadsheets or public datasets, then add the narrative and controls needed for a wider audience.
Use the same data across maps, charts, figures, filters, and explanatory sections.
Share a hosted link, embed the result, or use enterprise publishing options for additional control.
Ready to make it clear?
Start with a spreadsheet or talk with us about a larger publishing program.