Move from spreadsheet to story
Combine the reporting, data, and visual explanation in one workspace.

For newsrooms and publishers
Build responsive data stories that combine evidence, narrative, annotation, and interaction in one publishable experience.
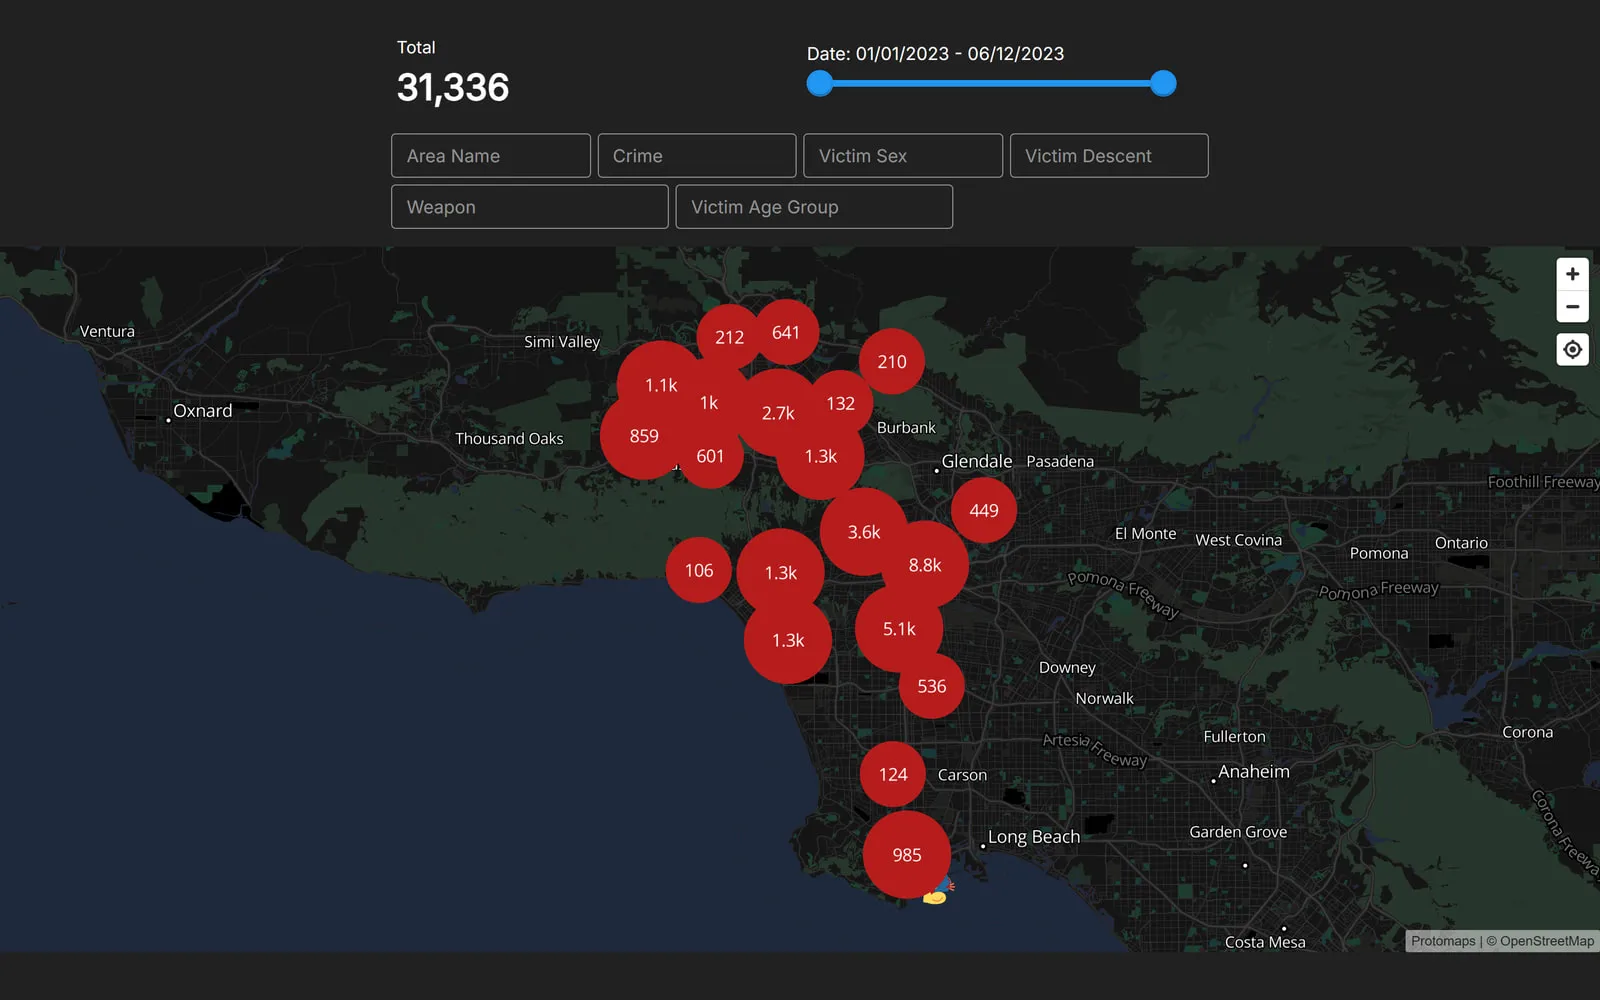
A complete story can open with the main finding, let readers explore their own group, and carry the reporting into detailed comparisons.
Open the exampleCombine the reporting, data, and visual explanation in one workspace.
Share by link, embed in an article, or export visual assets for other formats.
Edit every title, annotation, visual choice, and AI-assisted draft before publishing.
Let readers filter and compare without losing the narrative you created.
Keep annotations, labels, sources, and explanations beside the visual instead of scattering them across tools.
Apply brand styling and repeat successful story structures across recurring coverage.
Create stories that remain readable and interactive on the devices your audience already uses.
Ready to make it clear?
Start with a spreadsheet or talk with us about a larger publishing program.