Bring in data without friction
Bring your own data or explore reliable public datasets from the built-in catalog, then keep published work connected to its source.

Product features
Bring in your data, connect multiple visualizations, add narrative and interactive filters, and publish one complete experience from a single workspace.
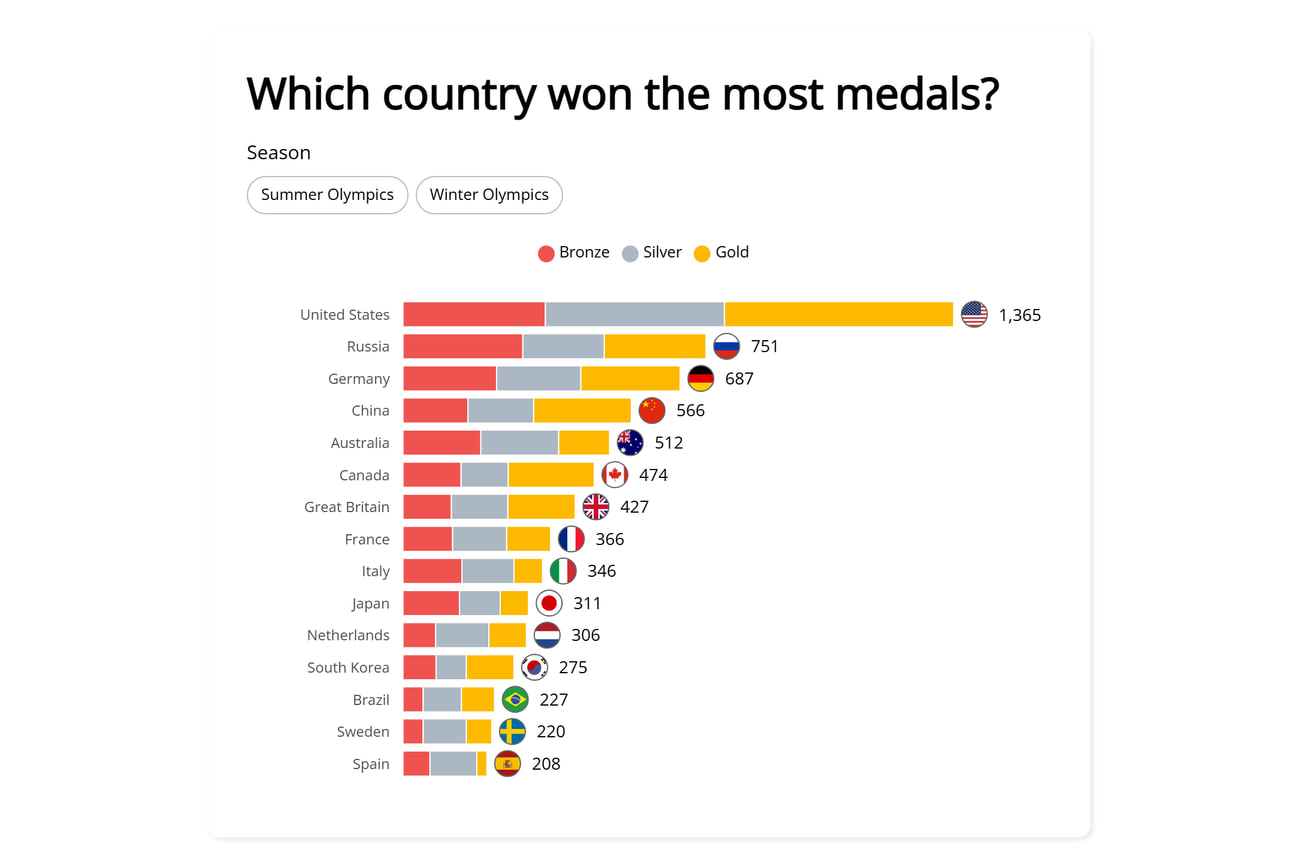 VisualizeUse charts, maps, tables, cards, figures, and text to give every idea the right form.Explore visualize
 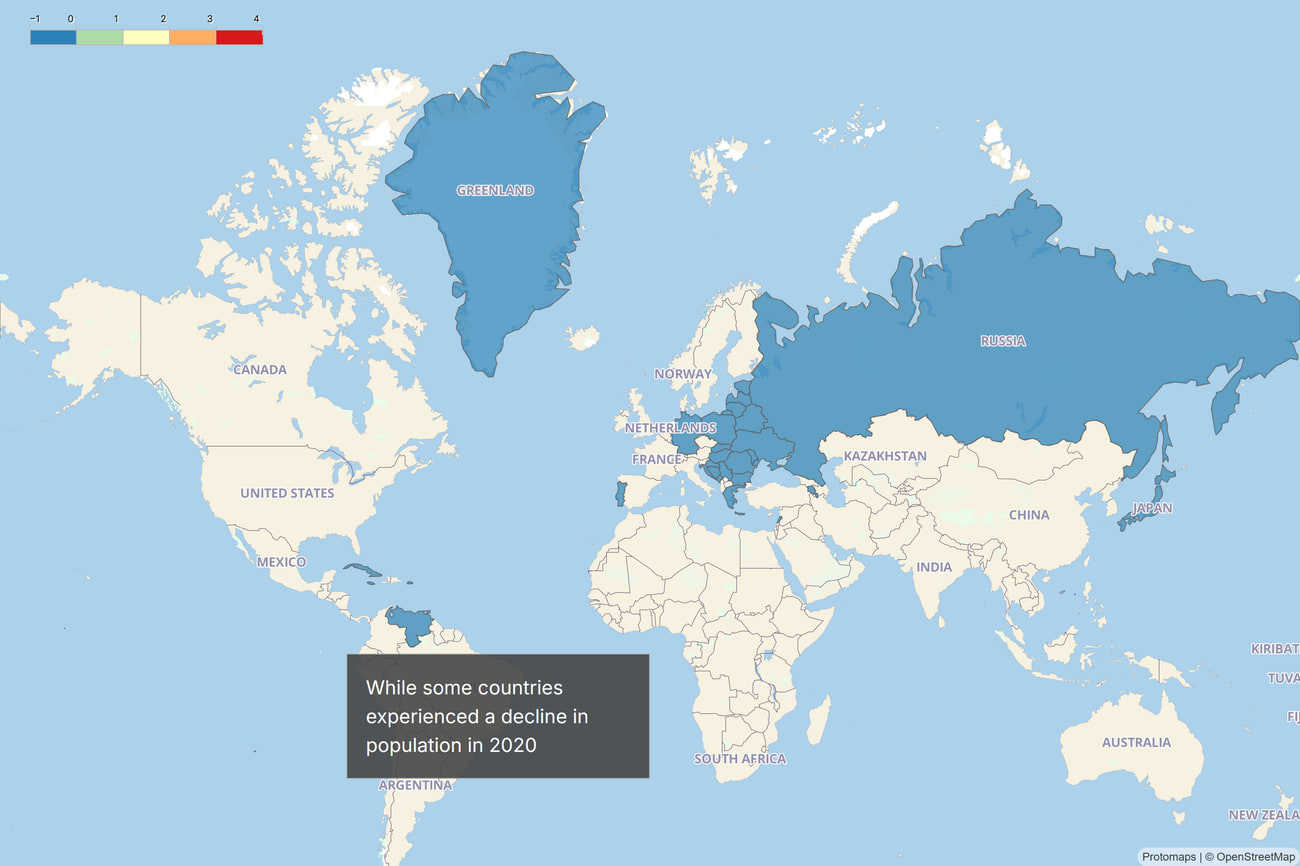 ExplainAdd narrative, annotations, tooltips, and scrollytelling to make the meaning clear.Explore explain
  PublishShare by link, embed on a website, use a custom domain, or self-host.Explore publish
 Made with Simpler Story
These live public stories show how the platform handles dense data, connected views, explanation, and publishing.
 View live story
 Map and filter
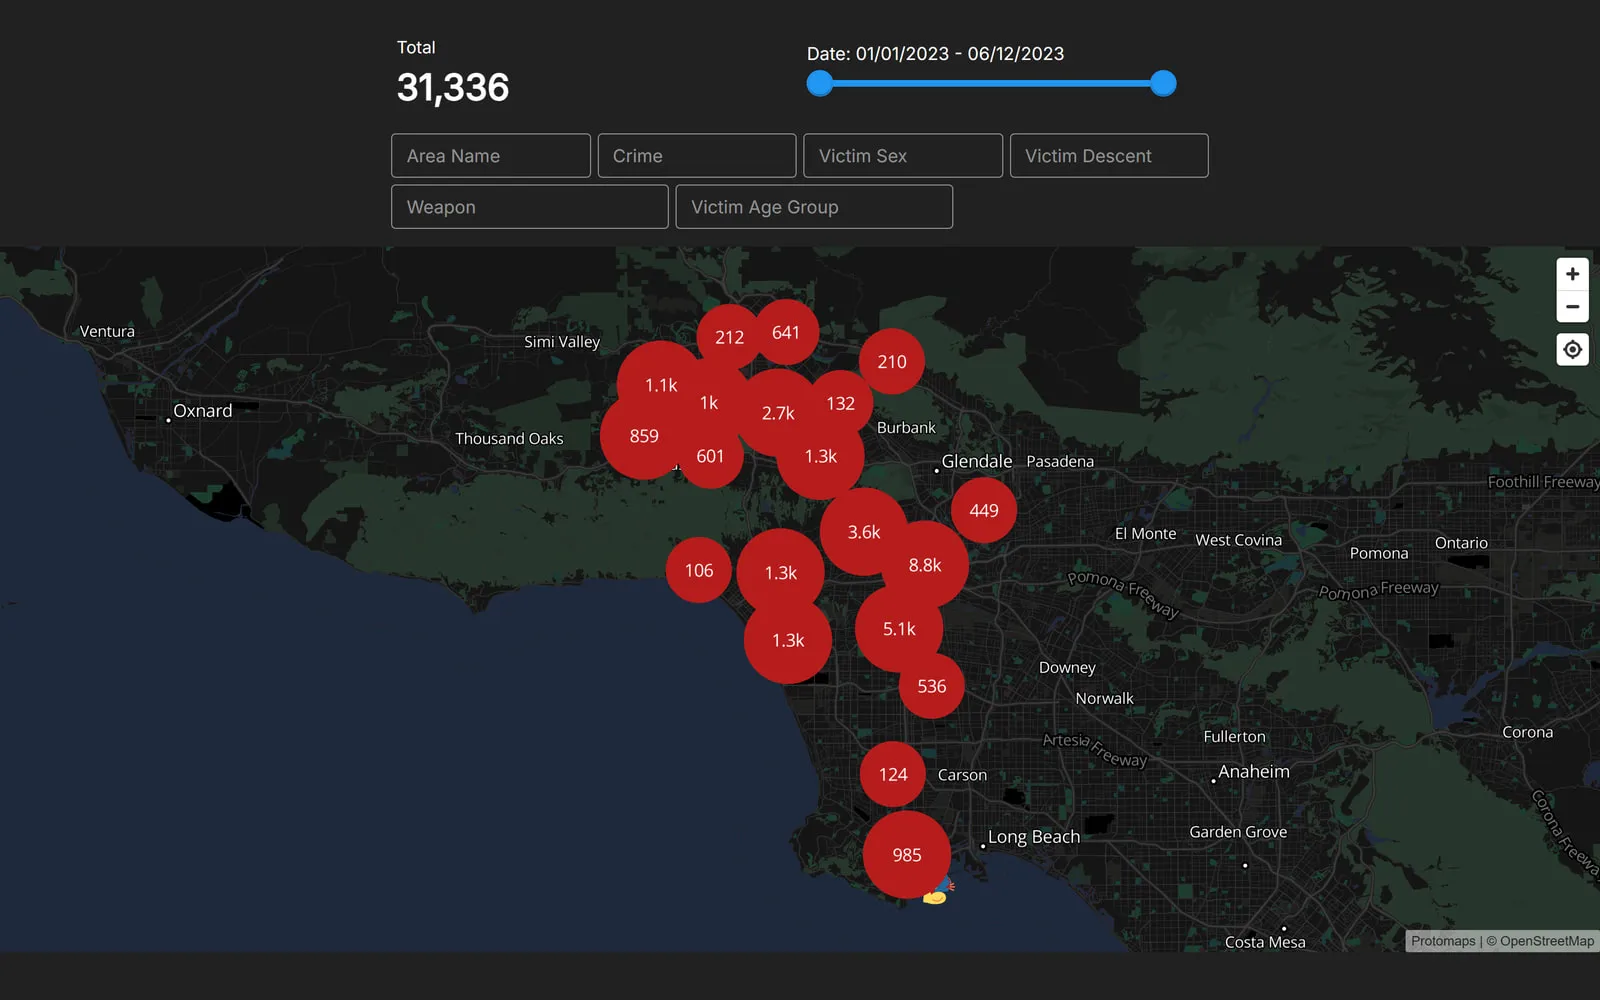
This Los Angeles crime story turns a dense incident dataset into a map readers can narrow by date, area, offence, and demographics. One source powers the map, the running total, the filters, and the ranked breakdown below.
Bring your own data or explore reliable public datasets from the built-in catalog, then keep published work connected to its source.
Connect multiple visualization types inside one story instead of stopping at a standalone chart or forcing every question into one dashboard.
 View live story
 Compare and explain
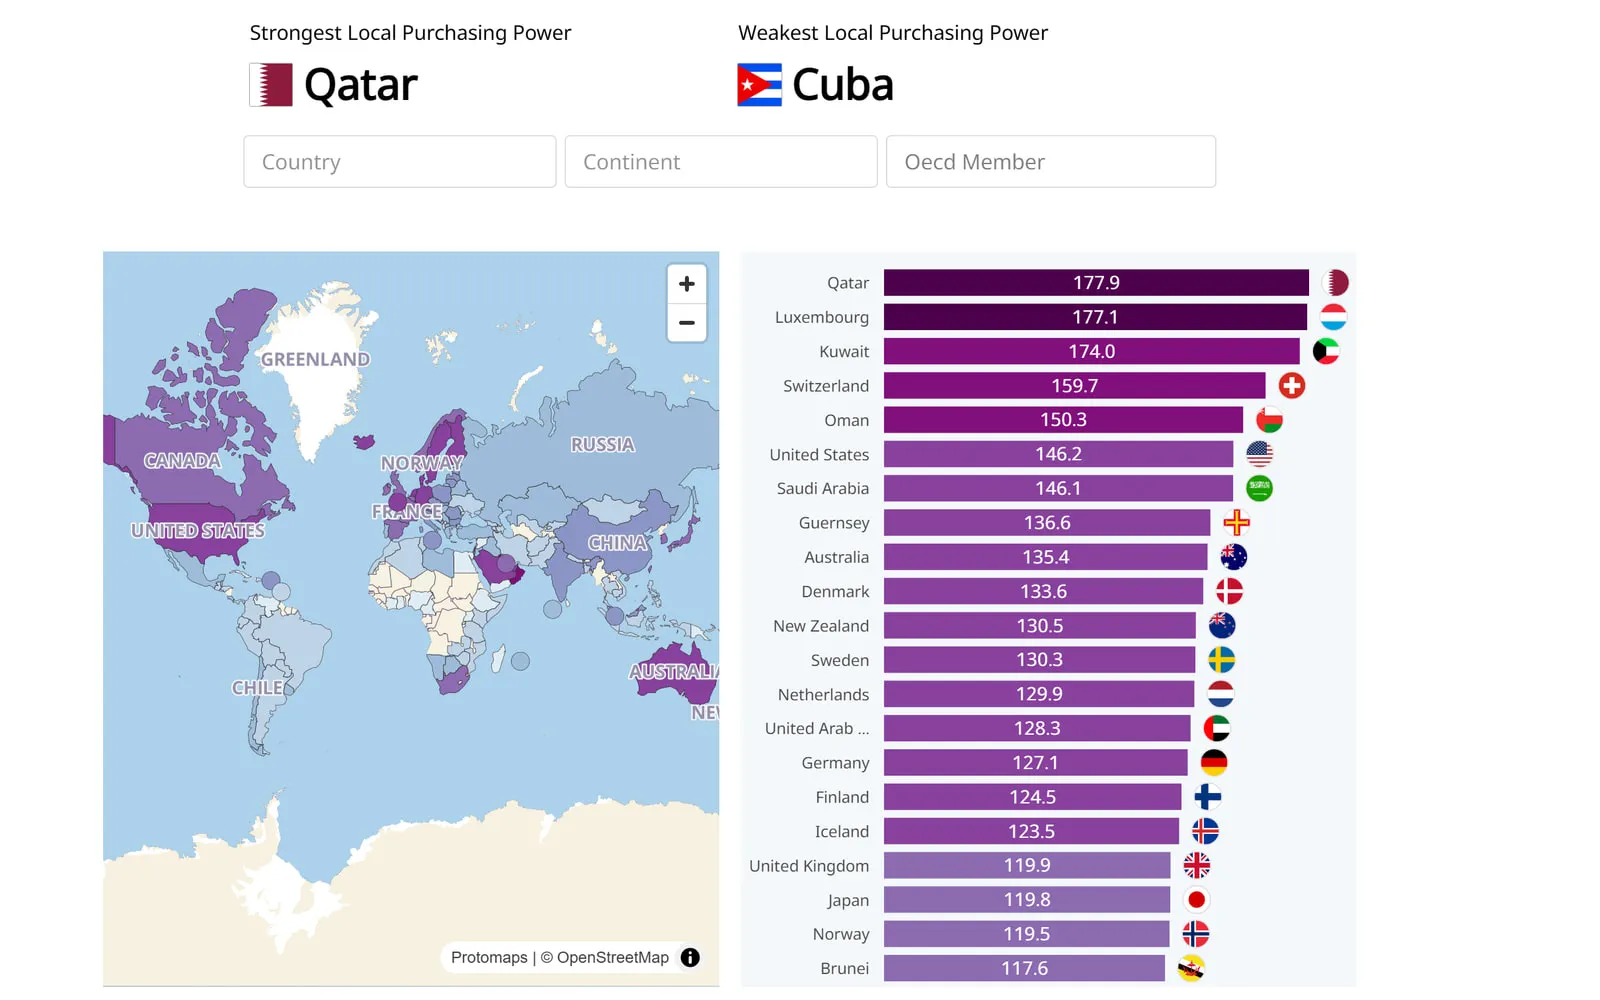
The purchasing-power story lets readers filter countries, read a world map and a ranked list side by side, and understand the result through labels, flags, and supporting context instead of a wall of dashboard controls.
Put context beside the data so readers understand what changed, why it matters, and where to look next.
Use filters, sliders, search, and play controls across the story so readers can explore without losing the narrative you created.
 View live story
 Connect multiple views
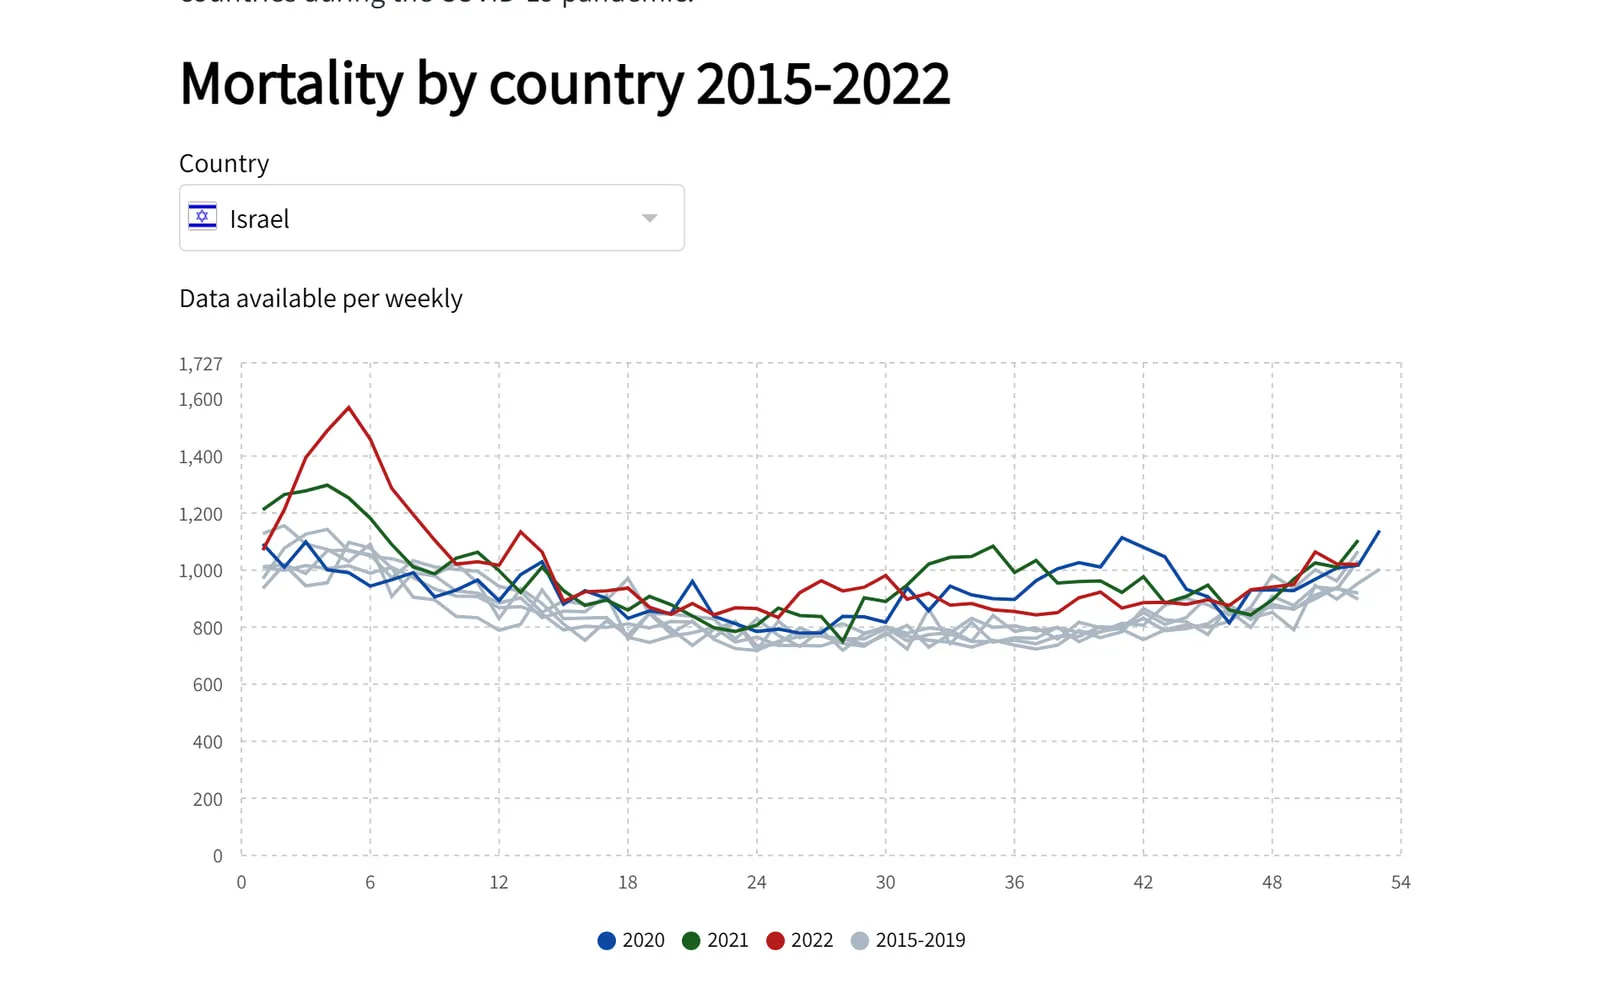
The World Mortality Dataset story uses a clear opening question, summary figures, filters, a chart, and a map as one continuous experience. Readers always know what they are looking at and what to do next.
Combine connected charts, maps, text, and controls into a sequenced experience that works on desktop and mobile.
 View live story
 Publish the whole story
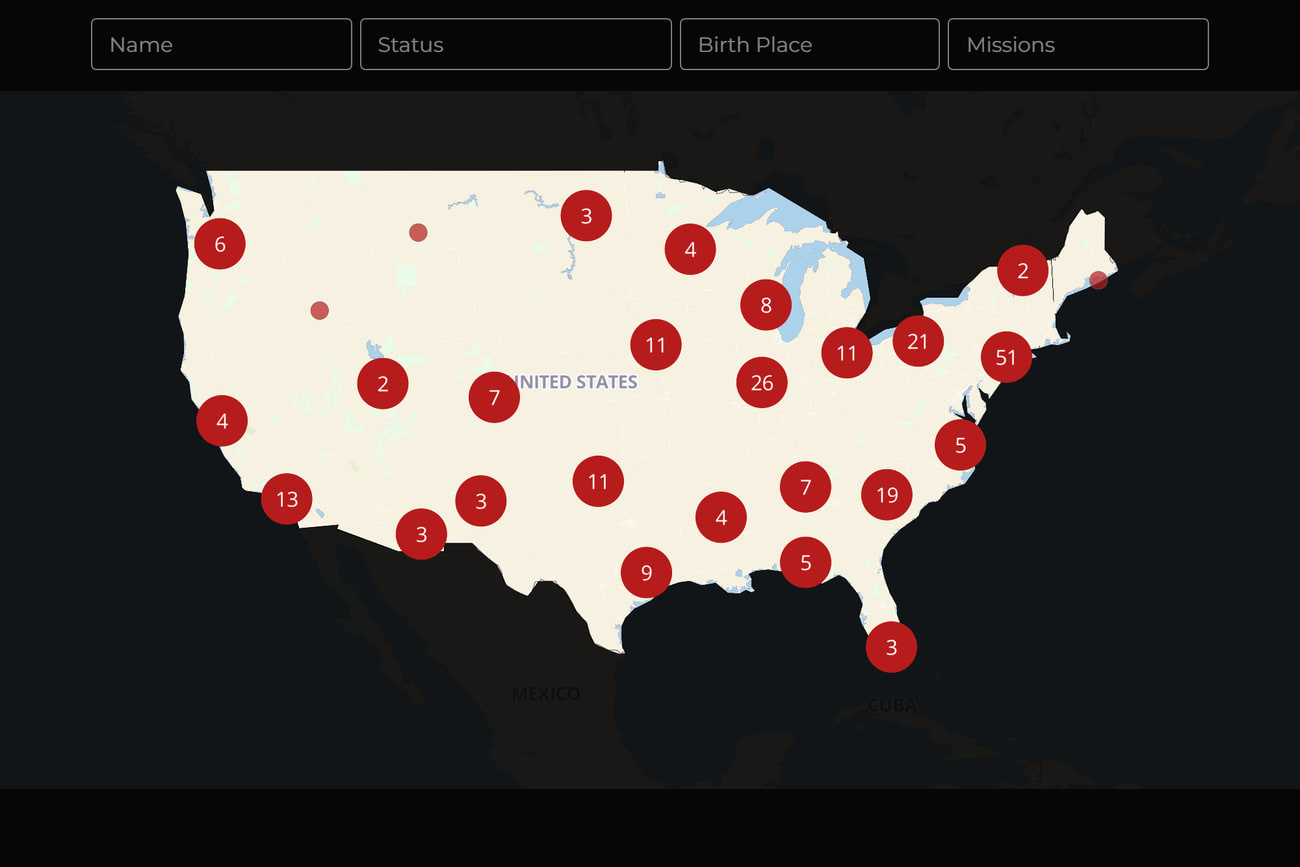
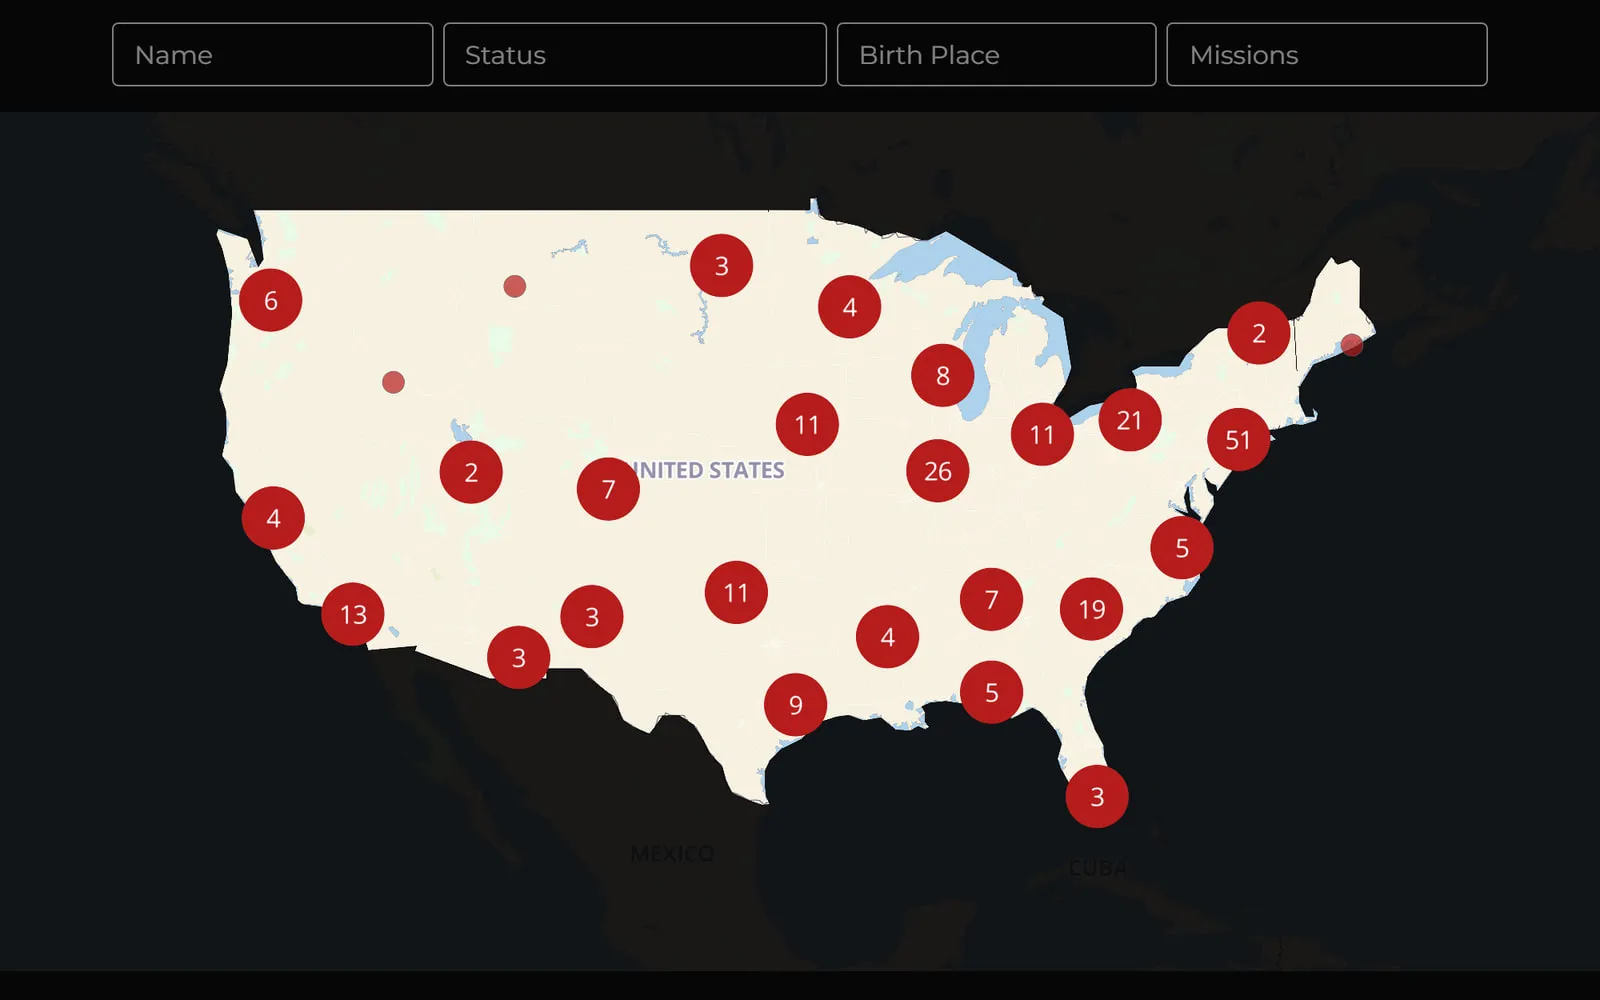
The NASA astronauts story moves from an editorial opening through connected charts, a play-through timeline, and a filterable map of where every astronaut was born, in one responsive published page. It can be shared directly or embedded where the audience already is.
Choose the destination that fits the audience, organization, and level of control you need.
AI that respects your data
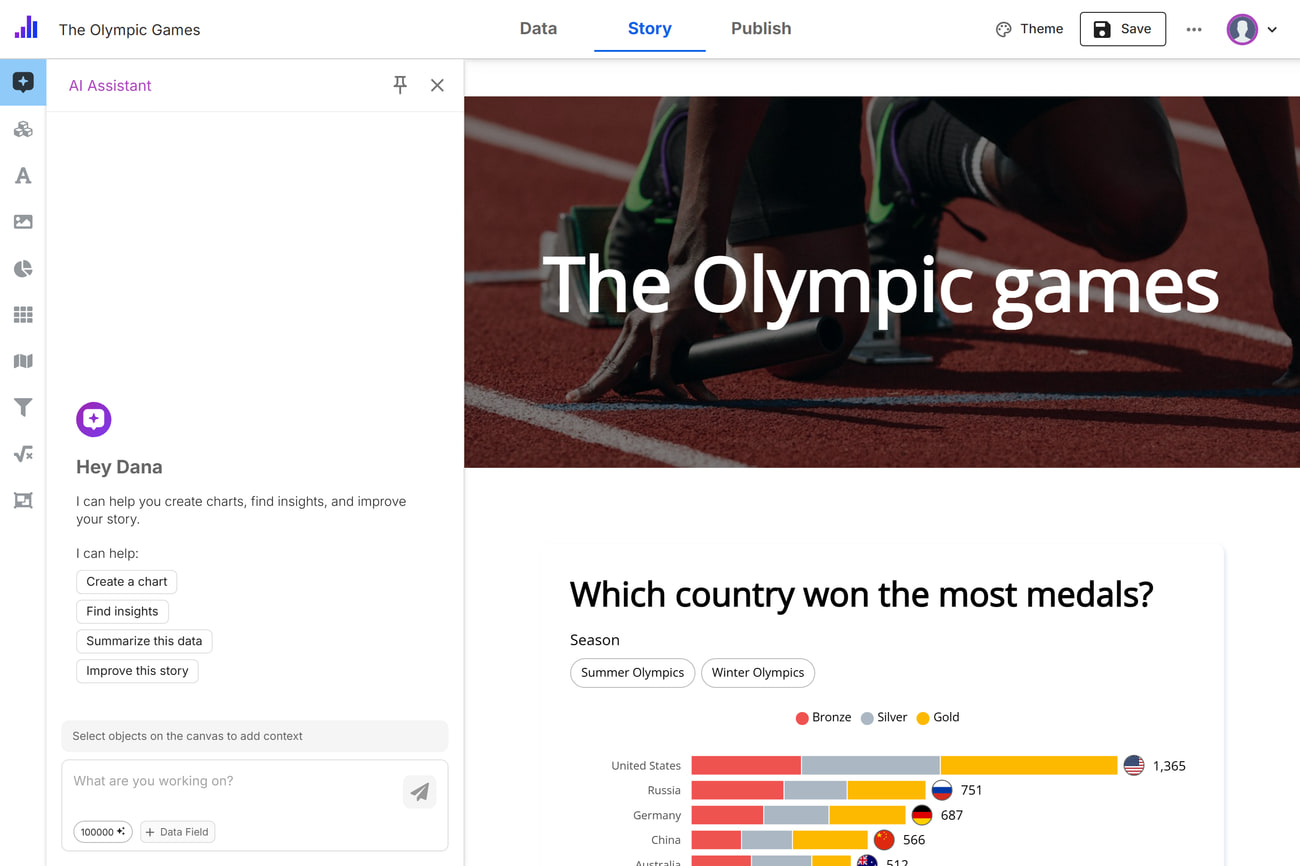
Simpler Story’s AI Assistant helps you choose interesting charts, draft titles and annotations, and generate images and icons while your source data stays untouched.
AI never rewrites or generates your underlying values. It works from field names, types, and safe summaries; every chart is rendered from your source data.
Everything AI creates is editable. Accept it, refine it, or build it by hand.
Ready to make it clear?
Start with the tools you already know. Publish something people can understand and explore.