More than standalone charts
Connect multiple views to the same data and carry the reader through a complete explanation.

Visualization
Choose from more than 30 visualization types, then connect charts, maps, figures, tables, and controls inside one complete story.
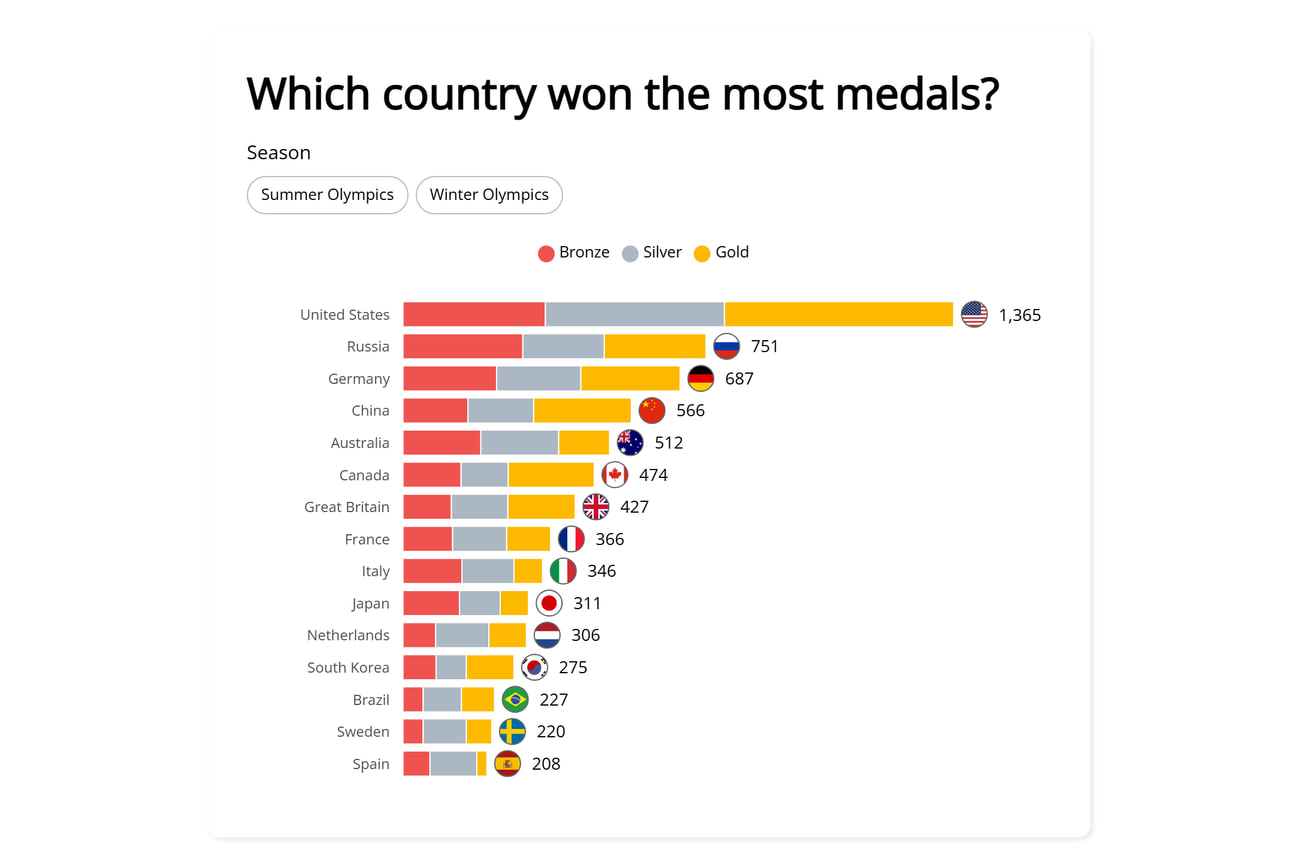
Connect multiple views to the same data and carry the reader through a complete explanation.
Add filters, sliders, search, popups, and play controls when they help readers answer a real question.
Build for desktop, tablet, and mobile from the same story.
Use the form that fits the point you need to make.
Offer meaningful exploration without turning the story into a dashboard.
Ready to make it clear?
Bring in your data, shape the explanation, and publish an experience people can follow.