Make findings approachable
Replace dense tables and static report graphics with guided, interactive explanation.

For research and nonprofits
Transform dense research, monitoring data, and public evidence into interactive stories people can understand, share, and use.
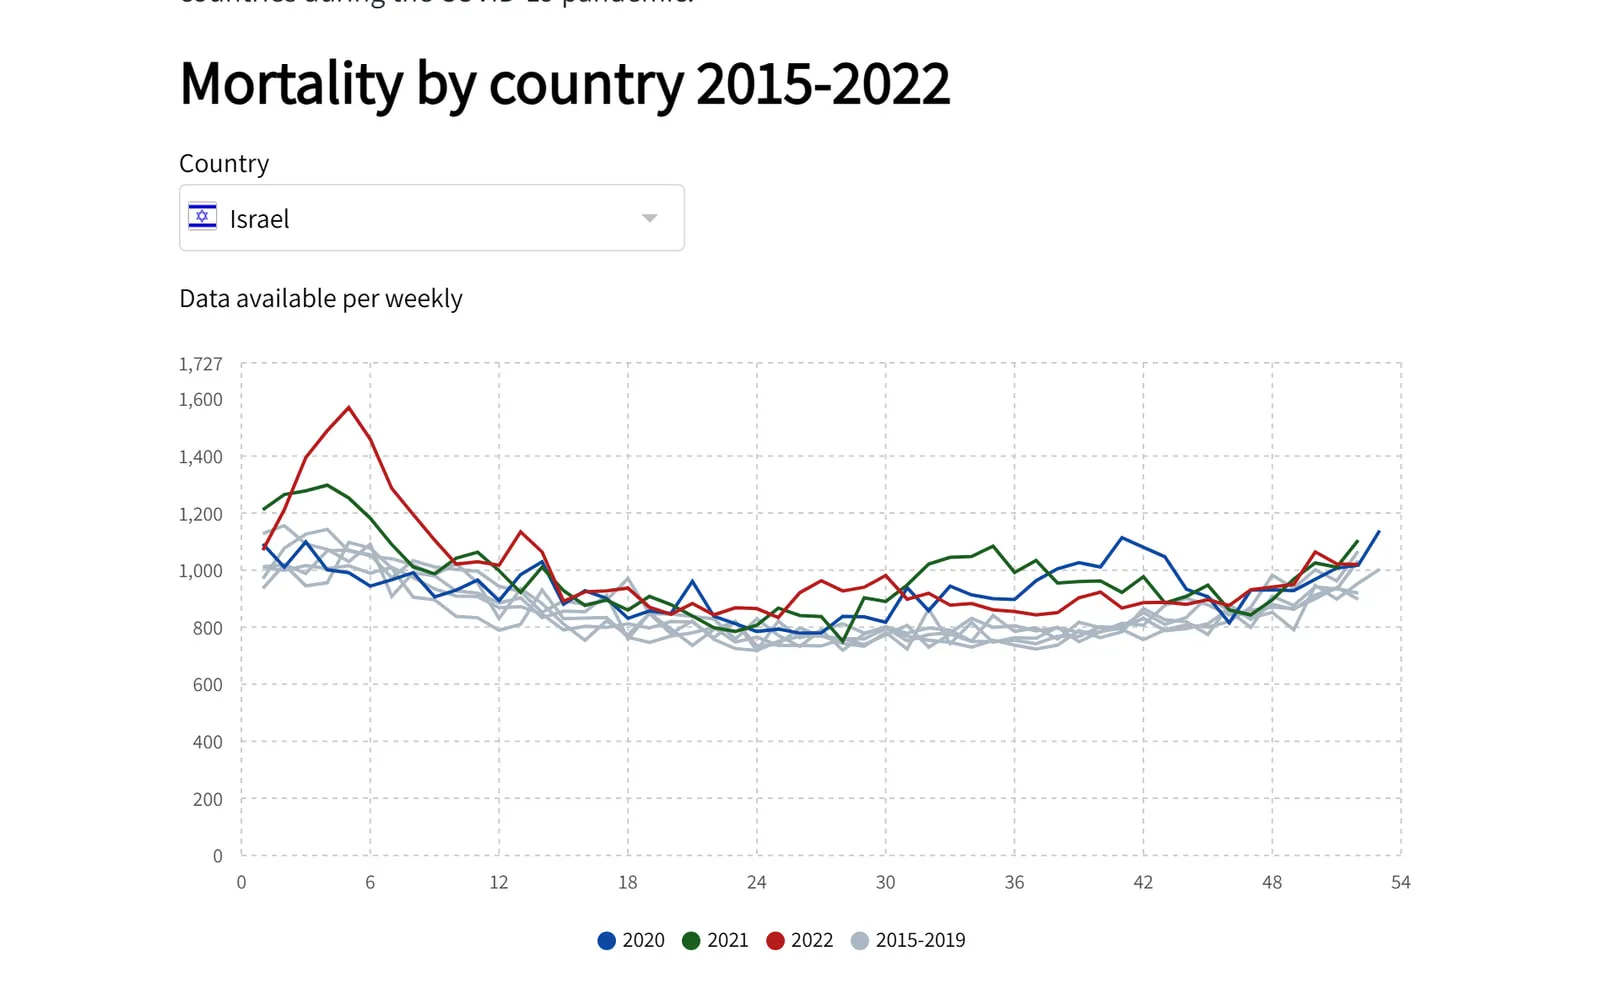
Combine summary findings, definitions, filters, maps, and detailed records so different audiences can enter the evidence at the right level.
Open the exampleReplace dense tables and static report graphics with guided, interactive explanation.
Keep methodology, annotations, labels, and supporting text close to the data.
Give general readers a clear path while allowing specialists to explore more detail.
Connect data once and use it across multiple visual and narrative elements.
Move beyond isolated charts by combining evidence, narrative, and reader controls in sequence.
Publish work that can be shared directly or embedded into an existing organizational site.
Use AI to explore directions and draft explanatory elements while keeping source values unchanged and every output editable.
Ready to make it clear?
Start with a spreadsheet or talk with us about a larger publishing program.